Policy choices matter in ensuring that Minnesota’s tax system is both fair and raises enough revenue to fund the state’s priorities. When considering how to improve the state and local tax structure, Minnesota policymakers should take into account two main facts:
- The difference between the share of income that the wealthiest pay in taxes and the share that the average Minnesotan pays has grown since the early 1990s.
- Taxes are a lower share of Minnesotans’ income today than in the mid-1990s, and are not raising adequate revenues to avoid persistent budget deficits.
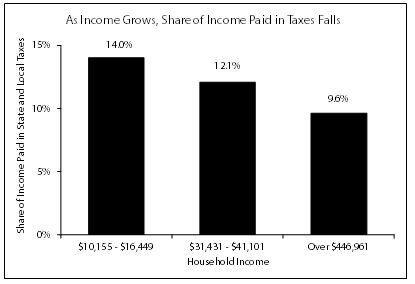
As Income Grows, the Share of Income Paid in Taxes Falls
The wealthiest one percent of Minnesotans (those with household incomes over $446,961) paid 9.6 percent of their incomes in total state and local taxes in 2010. This is significantly less than the 12.1 percent paid by a middle-income household making $31,431 to $41,101.[1]
Since 1990, tax fairness in Minnesota has declined.[2] Two factors help explain the growing gap. One is rising income inequality. In other words, the benefits of economic growth have gone disproportionately to those with the highest incomes.[3]
But policy choices are also part of the picture, including the shift in the mix of taxes. Minnesota today relies less on state taxes and more on local property taxes, which are based on home value and not as closely linked to someone’s ability to pay. In 2006, local taxes made up 26.4 percent of total state and local taxes in Minnesota.[4] They increased to 30.8 percent of total taxes in 2010.
Taxes Have Become a Smaller Piece of Minnesotans’ Budgets
Taxes are a smaller share of Minnesotans’ household budgets today than in the 1990s. Tax cuts enacted in the late 1990s and early 2000s, coupled with income growth, mean that Minnesotans have seen a nearly 11 percent drop in the share of their incomes they are paying in taxes. In 1996, Minnesotans paid 12.9 percent of their incomes in state and local taxes. By 2010, this had fallen to 11.5 percent.
Between 1997 and 2001, policymakers passed a significant number of tax cuts. Cuts were made to property taxes, income taxes and motor vehicle registration taxes, and one-time rebates totaling $3.7 billion were enacted in each legislative session between 1997 and 2001.[5]
Experience since that time demonstrates that those cuts went too far. Combined with revenue drops in response to tough economic times, Minnesota has faced frequent revenue shortfalls that have made it difficult to fund the state’s priorities.
Most Income Groups Pay in Proportion to their Share of Total Income
High-income Minnesotans pay a significant share of all taxes paid in the state, although it does not quite reflect their share of all income in the state.
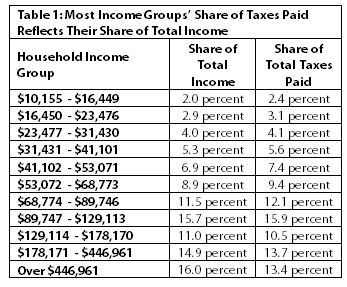
Most Minnesota income groups pay in rough proportion to their share of total income, although low- and middle-income groups pay more than their proportionate share, and groups with incomes above $129,114 pay less.[6]
The income group with the largest gap between its share of the state’s income and its share of total taxes is households with incomes over $446,961 (the wealthiest one percent). This group of Minnesotans had 16.0 percent of all income in the state, but paid 13.4 percent of total taxes.
Some Taxes are Distributed More Evenly Than Others
How much of each tax Minnesota households pay varies with their incomes. The sales tax makes up the largest share of the total tax bill for low-income Minnesotans, while property taxes make up the largest piece of total state and local taxes for middle-income Minnesotans, and higher-income Minnesotans pay more through the state income tax.
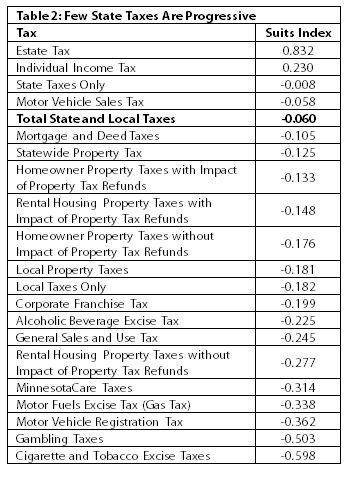
Minnesota’s estate tax and individual income tax are the state’s only progressive taxes – meaning that the higher one’s income, the larger the share of income paid for the tax. All other taxes that Minnesotans pay are regressive, where low- and middle-income households pay a higher share of their income in those taxes. Taxes on gambling and on cigarettes and tobacco products are the most regressive.
In Minnesota, the income tax only partially offsets the impact of other state and local taxes on low- and middle-income households. Overall, Minnesota’s state and local tax system is regressive, with a Suits Index of -0.060. The Suits Index measures the degree to which a tax is progressive or regressive. A Suits Index between 0 and +1 means the tax is progressive, and a Suits Index between 0 and -1 is regressive. Each tax type has a Suits Index that illustrates how regressive or progressive it is, as shown in Table 2 below.
The state’s tax system would be substantially more regressive without refundable income tax credits and property tax refunds. These include the Working Family Credit (the state’s version of the federal Earned Income Tax Credit), the Dependent Care Credit and the K-12 Education Credit that are part of the state’s income tax system; and the Property Tax Refund, known as the Circuit Breaker for homeowners and the Renters’ Credit for Renters. Absent these credits, Minnesota’s tax system would have a Suits index of -0.083.
Minnesota can do better. A slightly different methodology that allows for comparisons among states finds that 14 states have state and local tax systems that are less regressive than Minnesota’s.[7]
Because taxes vary in their Suits Indexes, changes in a particular tax will not be evenly felt across the board. It’s also the case that a change in a tax may not have the same incidence as the current tax.
Tax Reform Can Make the Tax System More Adequate and More Fair
Minnesota’s tax system is not meeting our needs. Tax reform should ensure that the tax system raises enough revenue to end the cycle of budget deficits and gimmicks that have plagued our state. And tax reform is needed so that low- and middle-income Minnesotans aren’t asked to pay more than their fair share.
In order to make Minnesota’s tax system less regressive, tax reform should focus on the one major tax based on ability to pay: the income tax. A targeted income tax increase is a critical component to make the share of income that the highest-income Minnesotans pay in state and local taxes more similar to what other Minnesotans pay. To the extent that comprehensive tax reform includes increases in regressive taxes, it should not rely on those regressive taxes too heavily, and should use tools such as refundable tax credits to offset some of the increases on low-income Minnesotans.
By Nan Madden