Minnesota has experienced a fairly strong economic recovery since the Great Recession, with low overall unemployment and a growing economy. However, many Minnesotans have not seen the wage growth we would expect nearly a decade into an economic recovery. And many still face barriers to finding good jobs and supporting themselves and their families, according to analysis of 2017 data from the Economic Policy Institute.
When workers’ wages don’t keep up with the cost of living, workers struggle to afford child care, transportation, housing, and health care – the basic building blocks of the standard of living they want to provide for their families. And without these things, they find it even harder to move ahead in the workforce. These findings underscore that economic growth on its own is not enough – there is a need for policy solutions that build a broader prosperity where economic opportunity is available to all Minnesotans.[1]
Economic Recovery has Mostly Brought Wage Growth to High-income Earners
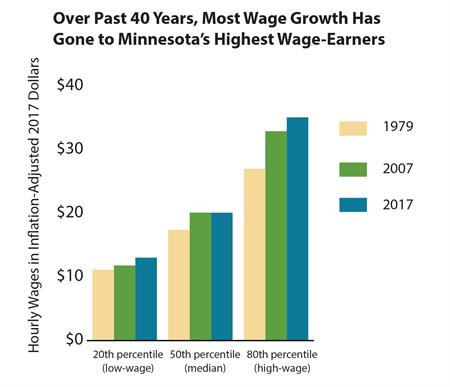
Although the recession ended in 2009, the economic recovery is more likely to be felt by high-income earners, while other workers are more likely to be left behind. Wages for Minnesota's low-wage workers still hover around pre-recession levels.
 The concentration of wage growth at higher incomes is not new, but rather the latest expression of a longer-term trend. Since 1979, the strongest wage growth nationally has gone to high-wage workers, with much slower growing wages for other American workers. In Minnesota, inflation-adjusted wages only increased by about 17 percent for low-wage workers since 1979, while high-wage workers’ wages increased by 30 percent.
But looking more recently, we are starting to see a different trend. Over the past two years, wages for low-wage workers in Minnesota have grown by about 9 percent, or $1.10 per hour. By comparison, wages for high-wage workers went up $1.28, or about 4 percent. This stronger wage growth for lower-wage workers likely demonstrates how, among other factors, minimum wage increases are boosting workers’ earnings, and starting to narrow the gap between their wages and what it takes to make ends meet.[2]
Many Jobs Don’t Pay Enough, So Workers Struggle to Make Ends Meet
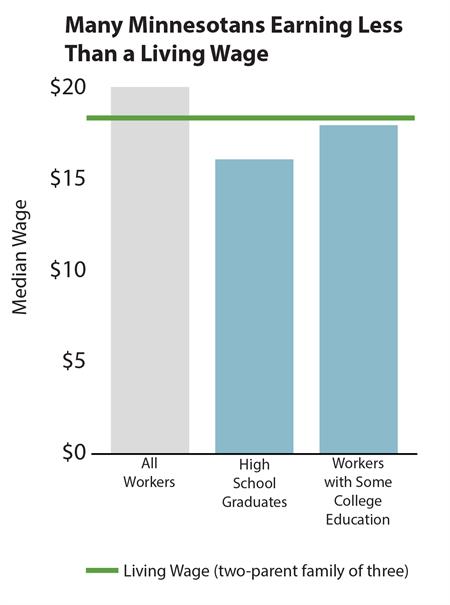
Many jobs in Minnesota pay less than what it takes to support a family. The Minnesota Department of Employment and Economic Development calculates that both adults in a typical family of three[3] would need to earn $18.47 per hour to afford their basic needs.[4] This basic needs budget only includes necessary expenses such as food, child care, housing, and health care. It does not include savings, entertainment, or vacations.
 However, there are just not enough living-wage jobs that pay enough to cover basic needs. At the end of 2017, the median wage offered for 9 out of 10 of the occupations with the highest number of job openings in Minnesota paid less than a living wage for even a single worker with no children.[5]
Some Minnesotans find it particularly challenging to get a living-wage job, such as workers with lower levels of formal education. In 2017, over half of Minnesota’s workers without a college degree made less than what it takes to support a family of three.
People of Color Are More Likely to Face Hurdles to Getting Ahead
Minnesota has a higher labor force participation rate than the national average, which means a greater share of our population aged 16 and older are in the workforce, defined as either having a job or looking for a job. Many communities of color are participating in the labor force in equal or even higher rates than the state average. Labor force participation for white and African-American Minnesotans is 71 percent, and over 80 percent of Hispanic Minnesotans participate in the labor force.[6]
Yet people of color are more likely to be underemployed, which is when a worker needs full-time employment but is only working part time, or is working in a job that doesn’t make full use of their skills. In 2017, while the overall underemployment rate was 6.5 percent, African-American Minnesotans were more than twice as likely to be underemployed; underemployment among Hispanic Minnesotans was 8.6 percent.
We know that communities of color often face barriers to economic security, from the lack of public investment in schools or transportation options in their communities, to discrimination in the labor market. With people of color making up an ever larger share of our workforce, and an increasing demand for workers in many industries and parts of the state, it’s crucial for the state's economic future that all Minnesotans have the opportunity to reach their fullest potential in the labor market.
Unions Have Supported Workers Across Minnesota and the Country
Unions allow workers to negotiate aspects of their employment through collective bargaining, which can result in earning higher wages, getting better access to health care, or making the workplace safer.
In 2017, about 15 percent of Minnesota’s workers were represented by unions, compared to 11 percent nationally. Minnesota has had a strong history of union membership. But this has dropped off since the mid-1980s when over 1 in 5 workers in Minnesota were represented by unions.[7]
This decline is part of a larger, national trend, and is worrying when paired with the recent Supreme Court decision in Janus v. AFSCME that will further weaken unions across the country. Higher levels of union representation have been associated with higher wages for both union and non-union workers. Furthermore, unions can help narrow wage inequalities, as unions have typically boosted wages and benefits for low- and middle-wage workers. And wage boosts as a result of unionization have been highest for low-wage workers, and for black and Hispanic workers – those who most often struggle to get ahead.[8] In Minnesota, the median wage for union workers was $24.49 in 2017, compared to $19.75 for non-union workers. Nationally, these wages are slightly lower, and the gap between wages is slightly higher. The national median wage for union workers is $23.05, while for non-union workers it is $17.70.
Policies to Boost Incomes and Support Workers Can Make a Difference
State policy choices can play an important role in building a future where all Minnesota workers benefit from the economic growth they help create. Policymakers can ensure that Minnesotans’ hard work translates into better living standards, and build a strong economic future for all of us by advancing:
- Policies that improve wage and job quality standards, such as expanding access to earned safe and sick time;
- Tax policies that boost the wages of struggling families and narrow, rather than amplify, income inequality, such as expanding the Working Family Tax Credit;
- Public investments that ensure Minnesotans can get the education and training they need, can afford child care, and can live near and get to good jobs; and
- Collective bargaining policies that support and give power to workers to organize for better compensation and work environments.
Minnesota can truly succeed when all workers are able to get ahead and make ends meet. Policies that support those who are disproportionately facing barriers in today’s economy are key to a strong future for us all.
By Clark Goldenrod