Minnesota's low unemployment rate and high labor force participation are two indicators of where Minnesota's economy is doing well. However, these numbers hide the fact that Minnesotans across the state are still struggling to get ahead even in the economic recovery.
The unemployment rate is a measure of those out of work and those actively looking for work. When the Great Recession ended in 2009, the unemployment rate in Minnesota was 8 percent. Since then, the unemployment rate in Minnesota has decreased, reaching 2.9 percent as of August 2018. This is a strong improvement, and is substantially lower than the national unemployment rate of 3.9 percent. But it is still the case that nearly 90,000 people were out of work.[1]
The kinds of Minnesota workers who struggled the most to maintain employment during the recession – those with less formal education, communities of color, people living in certain parts of the state, and the young – still face greater barriers to employment today than other Minnesotans.[2] For example, unemployment among Minnesotans with less than a high school diploma was five times as high as that for Minnesotans with a bachelor’s degree or higher. And unemployment among Minnesotans of color was twice that of white Minnesotans.
Knowing which Minnesotans struggle most to gain traction in the workforce means Minnesota policymakers can make smart policy choices. Policy solutions that help workers stay on the job, like expanded earned sick leave, and that help workers afford the things they need to succeed on the job, such as by increasing the availability of affordable child care, can build a broader, more durable prosperity in our state.
Minnesotans with Less Formal Education Face Hurdles in the Job Market
Minnesotans with lower levels of education experienced high rates of unemployment during the recession, and are still finding it more difficult to get a job than for other Minnesotans.
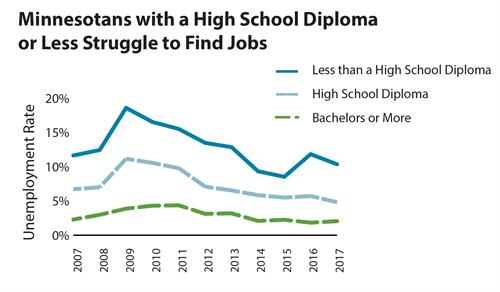
- Despite substantial gains since the recession, people with less than a high school diploma are still out of work at a significantly higher rate than any other educational group, with an unemployment rate of 10.4 percent in 2017.
- Unemployment for those with a high school diploma was 4.8 percent, over twice as high as for those with a bachelor’s degree.
- The unemployment rate for 4-year college graduates in 2017 was 2.1 percent. This group weathered the recession far better than others, and continues to experience very low levels of unemployment.
Unemployment Rate for Young People Still High
Young Minnesotans continue to be more likely than other age groups to be out of work; this can be a significant setback for people trying to get started in their careers and may harm their future earnings.
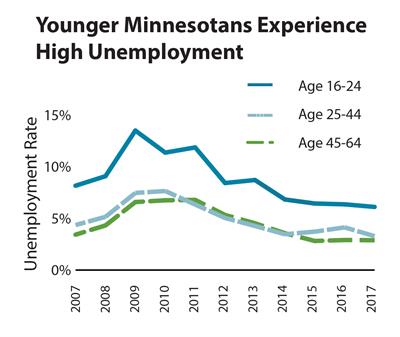
- Workers ages 16 to 24 have had a rough road to recovery. This group has a consistently higher unemployment rate than other age groups. Despite significantly coming down from its peak during the recession, the unemployment rate for young people has hovered over 6 percent for the past few years.
- Other age groups face much lower rates of unemployment: 3.3 percent for workers ages 25 to 44, and 2.9 percent for workers ages 45 to 64. These age groups also saw a less dramatic increase in unemployment during the recession.

Single Adults Continue to Face Hurdles to Employment During the Recovery
Households headed by a single adult experience more difficulty in Minnesota’s job market than households with two adults. A household headed by a single adult is particularly vulnerable after losing a job, since there isn’t a second income-earner to help weather a stretch of unemployment. Prolonged unemployment can be harmful to children, with the loss of wages making it difficult for parents to provide nutritious meals and a safe environment, and parental stress causing greater tension in the home.
[3] 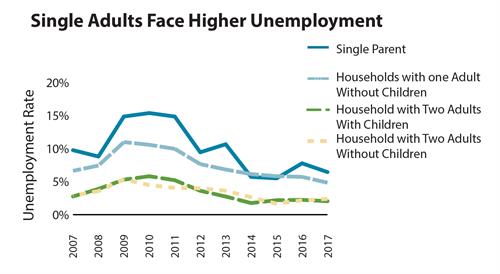
- Single-parents had the highest rates of unemployment during the recession and continue to do so. Even with substantial improvement since the recession, 6.5 percent of single parents in the workforce were looking for work in 2017.
- Single adults without children have experienced a slow, but fairly steady recovery since the recession. In 2017, 4.8 percent of single adults without children were out of work.
- Minnesotans in households with two adults – with and without children – have seen very low rates of unemployment for the past few years.[4] Since 2015, the unemployment rate for both of these groups has remained consistently around 2 percent.
Parts of Greater Minnesota Have Higher Unemployment Rates
The benefits of the economic recovery have not been equally felt in all parts of the state. Unemployment varies considerably across the state’s regions, with certain regions experiencing more employment opportunities than others.
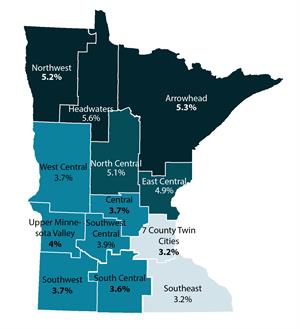
- The Headwaters region had the highest rate of unemployment in 2017, at 5.6 percent.[5] It was followed closely by the Arrowhead and Northwest regions, where the percent of Minnesotans out of work was 5.3 and 5.2 percent, respectively.
- Throughout most of the recession and following recovery, the Twin Cities and the Southeast regions experienced the lowest rates of unemployment. And in 2017, only 3.2 percent of people in the workforce were unemployed in these regions.
Minnesota’s Communities of Color Face Higher Unemployment
Communities of color have consistently had less access to employment opportunity than white Minnesotans. People of color face barriers that make it harder to get to and keep good jobs, including lack of investment in their communities’ schools and transportation infrastructure, as well as discrimination in the labor market. Disparities in unemployment rates among racial and ethnic groups also likely reflect some of the other unemployment gaps discussed in this paper, since people of color are more likely to be younger or have fewer years of formal education.
[6] Unemployment among people of color in Minnesota has improved since the recession, but still remains higher than for white Minnesotans.
[7] 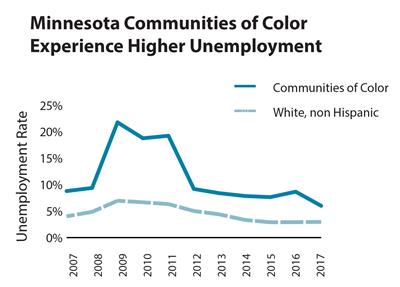
- Employment for communities of color has improved substantially since the recession. However, it is still the case that the unemployment rate for communities of color is 3 percentage points higher than for white Minnesotans.
- Unemployment for white Minnesotans went up less dramatically in the recession, and white Minnesotans continue to experience consistently lower unemployment. In 2017, the unemployment rate for white workers was 3.0 percent.
- It is important to acknowledge that different people, and different communities of color, have varied experiences. Some communities experience much higher barriers to unemployment. For example, another data source finds the unemployment rate in 2017 was about 14.5 percent for Native Americans, and about 8 percent for Black or African American Minnesotans.[8]
Smart Policy Solutions Can Improve Employment Opportunities
Despite overall improvement in unemployment, too many Minnesotans still face barriers to gaining a strong and consistent foothold in the workforce. Minnesota lawmakers should enact policy solutions that increase the employment security of those who are currently employed, and make it easier for workers to afford the basic expenses needed to get and stay on the job.
For example, one important step to helping workers maintain employment is expanding access to sick leave. In 2014, a study showed that 1.1 million Minnesota workers risked losing wages or even their jobs if they took time off when they or a family member were sick. Expanding sick leave has the greatest benefit for the kinds of Minnesota workers who face the highest levels of unemployment, because they are also those most likely to lack paid sick time. For example, 60 percent of Hispanic workers and 47 percent of Black workers in Minnesota lacked access to sick time in 2012.[9] Those figures have likely improved since some Minnesota cities have taken the lead in expanding access to sick leave; it’s time to expand this policy statewide.
Minnesota workers earning lower wages can find it difficult to afford child care, transportation, skills training, and other things they need to succeed in the workplace. For these workers, policies that boost their families’ incomes, such as the Working Family Credit, mean they can better afford those necessities, and can begin to save so that a temporary setback – such as a car breaking down – doesn’t snowball into bigger problems and job loss. Similarly, making affordable child care available to more families is crucial to keeping Minnesota’s working parents on the job.
Minnesota has experienced a strong recovery from the last recession, but it’s clear that too many Minnesotans across the state haven’t found the employment they are looking for. Through sound public policies, Minnesota policymakers can build a broader prosperity that reaches into every community and every corner of the state.
By Clark Goldenrod